cd43 antibody Search Results


94
Miltenyi Biotec cd43
Cd43, supplied by Miltenyi Biotec, used in various techniques. Bioz Stars score: 94/100, based on 1 PubMed citations. ZERO BIAS - scores, article reviews, protocol conditions and more
https://www.bioz.com/product/cd43+antibody/10__17816_slash_morph__681777-98-28-30?v=Miltenyi+Biotec
Average 94 stars, based on 1 article reviews
cd43 - by Bioz Stars, 2026-08
94/100 stars
  Buy from Supplier

90
R&D Systems mouse anti cd43 ly 48 microbeads
Mouse Anti Cd43 Ly 48 Microbeads, supplied by R&D Systems, used in various techniques. Bioz Stars score: 90/100, based on 1 PubMed citations. ZERO BIAS - scores, article reviews, protocol conditions and more
https://www.bioz.com/product/cd43+antibody/pm25801429-101-12-36?v=R%26D+Systems
Average 90 stars, based on 1 article reviews
mouse anti cd43 ly 48 microbeads - by Bioz Stars, 2026-08
90/100 stars
  Buy from Supplier

92
Miltenyi Biotec cd43 pe
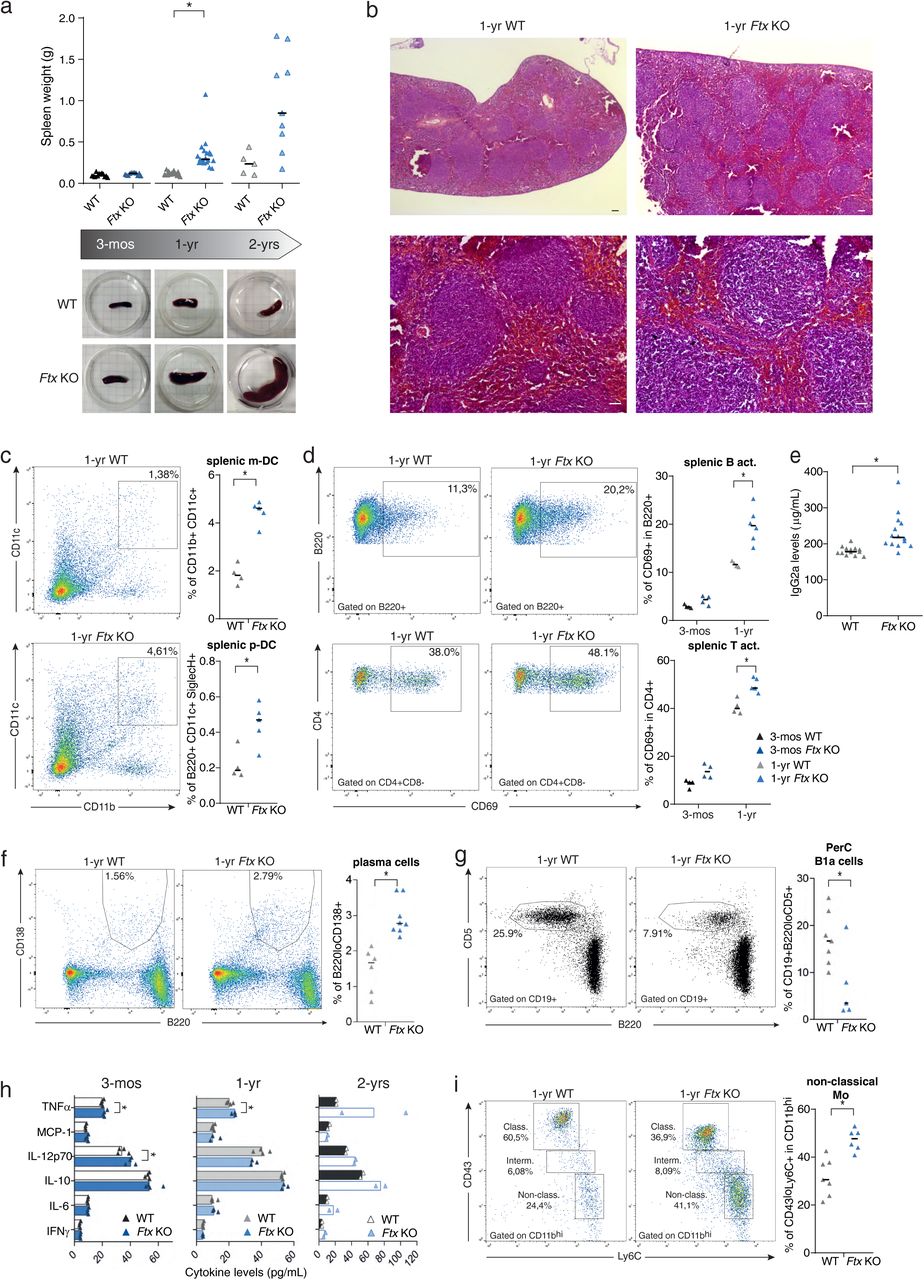
a. Spleen weight of wild-type (WT) and Ftx KO females at 3-months, 1-year and 2-years of age. Median values are shown. ( t-test , * p -values < 0.05). Underneath, representative images of WT and Ftx KO spleens from 3-month, 1-year and 2-year-old females. b. Representative images of hematoxylin-eosin staining on sections of spleens from 1-year-old WT and Ftx KO females. Scale bar; 100 μm. c. Representative flow cytometry analysis of splenic myeloid dendritic cells (m-DC) in WT and Ftx KO 1-year-old females. On the right, percentages of splenic m-DC (CD11b + CD11c + ) and splenic plasmacytoid dendritic cells (p-DC) (CD11c + B220 + SiglecH + ) in leucocytes. Each triangle represents a mouse. Median values are shown. ( t-test , * p -values < 0.05). d. Representative flow cytometry analysis of spontaneously activated B cells (B220 + CD69 + ) (upper panels) or of spontaneously activated T cells (CD4 + CD69 + ) (lower panels) in spleen from 1-year-old WT and Ftx KO females. Percentages in leucocytes are shown on the graphs beneath. Each triangle represents a mouse. Median values are shown. ( t-test , * p -values < 0.05). e. IgG2a natural antibody levels in sera of 1-year- and 2-year-old WT or Ftx KO females measured by ELISA. Each triangle represents a mouse. Median values are shown. ( t-test , * p -values < 0.05). f. Representative flow cytometry analysis of (B220 + CD138 + ) plasma cells in the spleen of 1-year-old WT and Ftx KO females. Percentages in leucocytes are shown on the graphs beneath. Each triangle represents a mouse. Median values are shown. ( t-test , * p -values < 0.05). g. Representative flow cytometry analysis of (CD19 + B220 lo CD5 + ) natural antibody producing B1a in the peritoneal cavity (PerC) of 1-year-old WT and Ftx KO females. Percentages in leucocytes are shown on the graphs beneath. Each triangle represents a mouse. Median values are shown. ( t-test , * p -values < 0.05). h. Cytokines levels in the blood analysed with CBA assays on sera from 3-month-, 1-year-, or 2-year-old WT and Ftx KO females. Each triangle represents a mouse. Median values are shown. ( t-test , * p -values < 0.05). i. Representative flow cytometry analysis of monocyte populations including non-classical (CD11b hi <t>CD43</t> lo Ly6C + ) scavenger monocytes in the spleen of 1-year-old WT and Ftx KO females. Percentages in leucocytes are shown on the graphs beneath. Each triangle represents a mouse. Median values are shown. ( t-test , * p -values < 0.05).
Cd43 Pe, supplied by Miltenyi Biotec, used in various techniques. Bioz Stars score: 92/100, based on 1 PubMed citations. ZERO BIAS - scores, article reviews, protocol conditions and more
https://www.bioz.com/product/cd43+antibody/bio_rxiv__2023__04__20__537662-150-57-59?v=Miltenyi+Biotec
Average 92 stars, based on 1 article reviews
cd43 pe - by Bioz Stars, 2026-08
92/100 stars
  Buy from Supplier

90
Miltenyi Biotec anti cd43 antibody
( A ) Serum antibodies from Aff3 flox/flox Cd4cre and Cd19cre mice were measured by ELISA ( n = 5 in each group). ( B ) Flow cytometry analysis of class switching to IgG1. <t>CD43</t> − B cells were harvested from Aff3 +/− (purple) or Aff3 −/− (red) mice and cultured with LPS and IL-4 (10 μg/ml). After 4 days, the cells were analyzed by flow cytometry. The panels show the IgG1 and IgG3 expression profiles and the statistical analysis ( n = 4 in each group). ( C ) Flow cytometry analysis of class switching to IgG2c. CD43 − B cells were cultured with LPS and IFN-γ (10 μg/ml). The panels show the IgG2c expression profiles and the statistical analysis ( n = 3 in each group). ( D ) Overexpression of the AFF3 compensated for the Aff3 −/− phenotype. CD43 − B cells were harvested from Aff3 −/− mice and cultured with LPS and IL-4. The cDNAs of Aff3 , Aff1 , and Aff4 were transduced with a retroviral vector carrying the green fluorescent protein (GFP) marker. The panel shows the percentage of IgG1 + cells in GFP + CD19 + cells ( n = 3 in each group). EV, empty vector. The data are shown as means ± SEM. * P < 0.05, *** P < 0.005, and **** P < 0.001. The P values were calculated using unpaired t test with Welch’s correction in (A to C) and via one-way ANOVA with Dunnett’s multiple comparisons test in (D). The data shown in this figure are representative of at least two experiments.
Anti Cd43 Antibody, supplied by Miltenyi Biotec, used in various techniques. Bioz Stars score: 90/100, based on 1 PubMed citations. ZERO BIAS - scores, article reviews, protocol conditions and more
https://www.bioz.com/product/cd43+antibody/pmc09401627-196-11-13?v=Miltenyi+Biotec
Average 90 stars, based on 1 article reviews
anti cd43 antibody - by Bioz Stars, 2026-08
90/100 stars
  Buy from Supplier

90
Proteintech cd43 antibody
( A ) Serum antibodies from Aff3 flox/flox Cd4cre and Cd19cre mice were measured by ELISA ( n = 5 in each group). ( B ) Flow cytometry analysis of class switching to IgG1. <t>CD43</t> − B cells were harvested from Aff3 +/− (purple) or Aff3 −/− (red) mice and cultured with LPS and IL-4 (10 μg/ml). After 4 days, the cells were analyzed by flow cytometry. The panels show the IgG1 and IgG3 expression profiles and the statistical analysis ( n = 4 in each group). ( C ) Flow cytometry analysis of class switching to IgG2c. CD43 − B cells were cultured with LPS and IFN-γ (10 μg/ml). The panels show the IgG2c expression profiles and the statistical analysis ( n = 3 in each group). ( D ) Overexpression of the AFF3 compensated for the Aff3 −/− phenotype. CD43 − B cells were harvested from Aff3 −/− mice and cultured with LPS and IL-4. The cDNAs of Aff3 , Aff1 , and Aff4 were transduced with a retroviral vector carrying the green fluorescent protein (GFP) marker. The panel shows the percentage of IgG1 + cells in GFP + CD19 + cells ( n = 3 in each group). EV, empty vector. The data are shown as means ± SEM. * P < 0.05, *** P < 0.005, and **** P < 0.001. The P values were calculated using unpaired t test with Welch’s correction in (A to C) and via one-way ANOVA with Dunnett’s multiple comparisons test in (D). The data shown in this figure are representative of at least two experiments.
Cd43 Antibody, supplied by Proteintech, used in various techniques. Bioz Stars score: 90/100, based on 1 PubMed citations. ZERO BIAS - scores, article reviews, protocol conditions and more
https://www.bioz.com/product/cd43+antibody/pmc07893666__jitc___2020___002026supp001-32-41-43?v=Proteintech
Average 90 stars, based on 1 article reviews
cd43 antibody - by Bioz Stars, 2026-08
90/100 stars
  Buy from Supplier

90
OriGene human psgl 1
( A ) Serum antibodies from Aff3 flox/flox Cd4cre and Cd19cre mice were measured by ELISA ( n = 5 in each group). ( B ) Flow cytometry analysis of class switching to IgG1. <t>CD43</t> − B cells were harvested from Aff3 +/− (purple) or Aff3 −/− (red) mice and cultured with LPS and IL-4 (10 μg/ml). After 4 days, the cells were analyzed by flow cytometry. The panels show the IgG1 and IgG3 expression profiles and the statistical analysis ( n = 4 in each group). ( C ) Flow cytometry analysis of class switching to IgG2c. CD43 − B cells were cultured with LPS and IFN-γ (10 μg/ml). The panels show the IgG2c expression profiles and the statistical analysis ( n = 3 in each group). ( D ) Overexpression of the AFF3 compensated for the Aff3 −/− phenotype. CD43 − B cells were harvested from Aff3 −/− mice and cultured with LPS and IL-4. The cDNAs of Aff3 , Aff1 , and Aff4 were transduced with a retroviral vector carrying the green fluorescent protein (GFP) marker. The panel shows the percentage of IgG1 + cells in GFP + CD19 + cells ( n = 3 in each group). EV, empty vector. The data are shown as means ± SEM. * P < 0.05, *** P < 0.005, and **** P < 0.001. The P values were calculated using unpaired t test with Welch’s correction in (A to C) and via one-way ANOVA with Dunnett’s multiple comparisons test in (D). The data shown in this figure are representative of at least two experiments.
Human Psgl 1, supplied by OriGene, used in various techniques. Bioz Stars score: 90/100, based on 1 PubMed citations. ZERO BIAS - scores, article reviews, protocol conditions and more
https://www.bioz.com/product/cd43+antibody/pm32193343-238-6-25?v=OriGene
Average 90 stars, based on 1 article reviews
human psgl 1 - by Bioz Stars, 2026-08
90/100 stars
  Buy from Supplier

97
Miltenyi Biotec anti cd23 microbeads
( A ) Serum antibodies from Aff3 flox/flox Cd4cre and Cd19cre mice were measured by ELISA ( n = 5 in each group). ( B ) Flow cytometry analysis of class switching to IgG1. <t>CD43</t> − B cells were harvested from Aff3 +/− (purple) or Aff3 −/− (red) mice and cultured with LPS and IL-4 (10 μg/ml). After 4 days, the cells were analyzed by flow cytometry. The panels show the IgG1 and IgG3 expression profiles and the statistical analysis ( n = 4 in each group). ( C ) Flow cytometry analysis of class switching to IgG2c. CD43 − B cells were cultured with LPS and IFN-γ (10 μg/ml). The panels show the IgG2c expression profiles and the statistical analysis ( n = 3 in each group). ( D ) Overexpression of the AFF3 compensated for the Aff3 −/− phenotype. CD43 − B cells were harvested from Aff3 −/− mice and cultured with LPS and IL-4. The cDNAs of Aff3 , Aff1 , and Aff4 were transduced with a retroviral vector carrying the green fluorescent protein (GFP) marker. The panel shows the percentage of IgG1 + cells in GFP + CD19 + cells ( n = 3 in each group). EV, empty vector. The data are shown as means ± SEM. * P < 0.05, *** P < 0.005, and **** P < 0.001. The P values were calculated using unpaired t test with Welch’s correction in (A to C) and via one-way ANOVA with Dunnett’s multiple comparisons test in (D). The data shown in this figure are representative of at least two experiments.
Anti Cd23 Microbeads, supplied by Miltenyi Biotec, used in various techniques. Bioz Stars score: 97/100, based on 1 PubMed citations. ZERO BIAS - scores, article reviews, protocol conditions and more
https://www.bioz.com/product/cd43+antibody/pm37095377-558-15-18?v=Miltenyi+Biotec
Average 97 stars, based on 1 article reviews
anti cd23 microbeads - by Bioz Stars, 2026-08
97/100 stars
  Buy from Supplier

90
Miltenyi Biotec cd43 apc miltenyi biotec df t1
( A ) Serum antibodies from Aff3 flox/flox Cd4cre and Cd19cre mice were measured by ELISA ( n = 5 in each group). ( B ) Flow cytometry analysis of class switching to IgG1. <t>CD43</t> − B cells were harvested from Aff3 +/− (purple) or Aff3 −/− (red) mice and cultured with LPS and IL-4 (10 μg/ml). After 4 days, the cells were analyzed by flow cytometry. The panels show the IgG1 and IgG3 expression profiles and the statistical analysis ( n = 4 in each group). ( C ) Flow cytometry analysis of class switching to IgG2c. CD43 − B cells were cultured with LPS and IFN-γ (10 μg/ml). The panels show the IgG2c expression profiles and the statistical analysis ( n = 3 in each group). ( D ) Overexpression of the AFF3 compensated for the Aff3 −/− phenotype. CD43 − B cells were harvested from Aff3 −/− mice and cultured with LPS and IL-4. The cDNAs of Aff3 , Aff1 , and Aff4 were transduced with a retroviral vector carrying the green fluorescent protein (GFP) marker. The panel shows the percentage of IgG1 + cells in GFP + CD19 + cells ( n = 3 in each group). EV, empty vector. The data are shown as means ± SEM. * P < 0.05, *** P < 0.005, and **** P < 0.001. The P values were calculated using unpaired t test with Welch’s correction in (A to C) and via one-way ANOVA with Dunnett’s multiple comparisons test in (D). The data shown in this figure are representative of at least two experiments.
Cd43 Apc Miltenyi Biotec Df T1, supplied by Miltenyi Biotec, used in various techniques. Bioz Stars score: 90/100, based on 1 PubMed citations. ZERO BIAS - scores, article reviews, protocol conditions and more
https://www.bioz.com/product/cd43+antibody/pmc05940870__41467_2018_4134_MOESM1_ESM-51-154-156?v=Miltenyi+Biotec
Average 90 stars, based on 1 article reviews
cd43 apc miltenyi biotec df t1 - by Bioz Stars, 2026-08
90/100 stars
  Buy from Supplier

90
R&D Systems cd43
( A ) Serum antibodies from Aff3 flox/flox Cd4cre and Cd19cre mice were measured by ELISA ( n = 5 in each group). ( B ) Flow cytometry analysis of class switching to IgG1. <t>CD43</t> − B cells were harvested from Aff3 +/− (purple) or Aff3 −/− (red) mice and cultured with LPS and IL-4 (10 μg/ml). After 4 days, the cells were analyzed by flow cytometry. The panels show the IgG1 and IgG3 expression profiles and the statistical analysis ( n = 4 in each group). ( C ) Flow cytometry analysis of class switching to IgG2c. CD43 − B cells were cultured with LPS and IFN-γ (10 μg/ml). The panels show the IgG2c expression profiles and the statistical analysis ( n = 3 in each group). ( D ) Overexpression of the AFF3 compensated for the Aff3 −/− phenotype. CD43 − B cells were harvested from Aff3 −/− mice and cultured with LPS and IL-4. The cDNAs of Aff3 , Aff1 , and Aff4 were transduced with a retroviral vector carrying the green fluorescent protein (GFP) marker. The panel shows the percentage of IgG1 + cells in GFP + CD19 + cells ( n = 3 in each group). EV, empty vector. The data are shown as means ± SEM. * P < 0.05, *** P < 0.005, and **** P < 0.001. The P values were calculated using unpaired t test with Welch’s correction in (A to C) and via one-way ANOVA with Dunnett’s multiple comparisons test in (D). The data shown in this figure are representative of at least two experiments.
Cd43, supplied by R&D Systems, used in various techniques. Bioz Stars score: 90/100, based on 1 PubMed citations. ZERO BIAS - scores, article reviews, protocol conditions and more
https://www.bioz.com/product/cd43+antibody/pm31534221-844-76-98?v=R%26D+Systems
Average 90 stars, based on 1 article reviews
cd43 - by Bioz Stars, 2026-08
90/100 stars
  Buy from Supplier

94
Novus Biologicals alexa fluor 647 anti cd43 sialophorin
( A ) Serum antibodies from Aff3 flox/flox Cd4cre and Cd19cre mice were measured by ELISA ( n = 5 in each group). ( B ) Flow cytometry analysis of class switching to IgG1. <t>CD43</t> − B cells were harvested from Aff3 +/− (purple) or Aff3 −/− (red) mice and cultured with LPS and IL-4 (10 μg/ml). After 4 days, the cells were analyzed by flow cytometry. The panels show the IgG1 and IgG3 expression profiles and the statistical analysis ( n = 4 in each group). ( C ) Flow cytometry analysis of class switching to IgG2c. CD43 − B cells were cultured with LPS and IFN-γ (10 μg/ml). The panels show the IgG2c expression profiles and the statistical analysis ( n = 3 in each group). ( D ) Overexpression of the AFF3 compensated for the Aff3 −/− phenotype. CD43 − B cells were harvested from Aff3 −/− mice and cultured with LPS and IL-4. The cDNAs of Aff3 , Aff1 , and Aff4 were transduced with a retroviral vector carrying the green fluorescent protein (GFP) marker. The panel shows the percentage of IgG1 + cells in GFP + CD19 + cells ( n = 3 in each group). EV, empty vector. The data are shown as means ± SEM. * P < 0.05, *** P < 0.005, and **** P < 0.001. The P values were calculated using unpaired t test with Welch’s correction in (A to C) and via one-way ANOVA with Dunnett’s multiple comparisons test in (D). The data shown in this figure are representative of at least two experiments.
Alexa Fluor 647 Anti Cd43 Sialophorin, supplied by Novus Biologicals, used in various techniques. Bioz Stars score: 94/100, based on 1 PubMed citations. ZERO BIAS - scores, article reviews, protocol conditions and more
https://www.bioz.com/product/cd43+antibody/pmc11018308-441-34-40?v=Novus+Biologicals
Average 94 stars, based on 1 article reviews
alexa fluor 647 anti cd43 sialophorin - by Bioz Stars, 2026-08
94/100 stars
  Buy from Supplier

cd43  (Bethyl)
92
Bethyl cd43
( A ) Serum antibodies from Aff3 flox/flox Cd4cre and Cd19cre mice were measured by ELISA ( n = 5 in each group). ( B ) Flow cytometry analysis of class switching to IgG1. <t>CD43</t> − B cells were harvested from Aff3 +/− (purple) or Aff3 −/− (red) mice and cultured with LPS and IL-4 (10 μg/ml). After 4 days, the cells were analyzed by flow cytometry. The panels show the IgG1 and IgG3 expression profiles and the statistical analysis ( n = 4 in each group). ( C ) Flow cytometry analysis of class switching to IgG2c. CD43 − B cells were cultured with LPS and IFN-γ (10 μg/ml). The panels show the IgG2c expression profiles and the statistical analysis ( n = 3 in each group). ( D ) Overexpression of the AFF3 compensated for the Aff3 −/− phenotype. CD43 − B cells were harvested from Aff3 −/− mice and cultured with LPS and IL-4. The cDNAs of Aff3 , Aff1 , and Aff4 were transduced with a retroviral vector carrying the green fluorescent protein (GFP) marker. The panel shows the percentage of IgG1 + cells in GFP + CD19 + cells ( n = 3 in each group). EV, empty vector. The data are shown as means ± SEM. * P < 0.05, *** P < 0.005, and **** P < 0.001. The P values were calculated using unpaired t test with Welch’s correction in (A to C) and via one-way ANOVA with Dunnett’s multiple comparisons test in (D). The data shown in this figure are representative of at least two experiments.
Cd43, supplied by Bethyl, used in various techniques. Bioz Stars score: 92/100, based on 1 PubMed citations. ZERO BIAS - scores, article reviews, protocol conditions and more
https://www.bioz.com/product/cd43+antibody/pmc11369666__CB___005___D4CB00093E___s001-108-15-23?v=Bethyl
Average 92 stars, based on 1 article reviews
cd43 - by Bioz Stars, 2026-08
92/100 stars
  Buy from Supplier

92
R&D Systems goat anti human cd43
CD38 is co-expressed with known regulators of CD45 activity in activated CLL cells (A) Stimulated CLL cells display a robust increase in the CD38 + <t>/CD43</t> hi population. Additionally, CD43 hi /galectin-1 + population (a previously identified CD45 activity hi population) has high CD38 expression in comparison to the CD43 lo /galectin-1 − counterpart population. Top row are representative flow cytometry scatterplots of CD38 + /CD43 hi populations in unstimulated and stimulated CLL cells. Bottom row is a representative scatterplot of stimulated CD43 hi /galectin-1 + and CD43 lo /galectin-1 − CLL populations and a representative histogram of CD38 expression in those populations. (B) When assessing stimulated CLL cells, the CD38 + /CD43 hi population had the highest CD45 activity, galectin-1 expression, and proliferative output when compared to CD38 + /CD43 lo and CD38 − /CD43 lo populations. Included are representative histograms for each respective parameter and a representative flow cytometry scatterplot delineating the populations. (C) Confocal images localizing CD38 (blue), CD45 (green), and CD43 (red) in isolated CLL cells. A region of interest was taken from the overlay and the fluorophore intensity (y axis, RGB profiler tool) plotted at a given pixel number (x axis). Statistical significance was defined with Wilcoxon matched-pairs signed rank test (A) and Friedman’s test with Dunn’s multiple comparisons test (B). Data is representative of 11 CLL patient samples (A, top row), 9 patient samples (A, bottom row), and 16 (left), 13 (middle), and 16 (right) patients for (B).
Goat Anti Human Cd43, supplied by R&D Systems, used in various techniques. Bioz Stars score: 92/100, based on 1 PubMed citations. ZERO BIAS - scores, article reviews, protocol conditions and more
https://www.bioz.com/product/cd43+antibody/pmc11519781-252-21-25?v=R%26D+Systems
Average 92 stars, based on 1 article reviews
goat anti human cd43 - by Bioz Stars, 2026-08
92/100 stars
  Buy from Supplier

Image Search Results


a. Spleen weight of wild-type (WT) and Ftx KO females at 3-months, 1-year and 2-years of age. Median values are shown. ( t-test , * p -values < 0.05). Underneath, representative images of WT and Ftx KO spleens from 3-month, 1-year and 2-year-old females. b. Representative images of hematoxylin-eosin staining on sections of spleens from 1-year-old WT and Ftx KO females. Scale bar; 100 μm. c. Representative flow cytometry analysis of splenic myeloid dendritic cells (m-DC) in WT and Ftx KO 1-year-old females. On the right, percentages of splenic m-DC (CD11b + CD11c + ) and splenic plasmacytoid dendritic cells (p-DC) (CD11c + B220 + SiglecH + ) in leucocytes. Each triangle represents a mouse. Median values are shown. ( t-test , * p -values < 0.05). d. Representative flow cytometry analysis of spontaneously activated B cells (B220 + CD69 + ) (upper panels) or of spontaneously activated T cells (CD4 + CD69 + ) (lower panels) in spleen from 1-year-old WT and Ftx KO females. Percentages in leucocytes are shown on the graphs beneath. Each triangle represents a mouse. Median values are shown. ( t-test , * p -values < 0.05). e. IgG2a natural antibody levels in sera of 1-year- and 2-year-old WT or Ftx KO females measured by ELISA. Each triangle represents a mouse. Median values are shown. ( t-test , * p -values < 0.05). f. Representative flow cytometry analysis of (B220 + CD138 + ) plasma cells in the spleen of 1-year-old WT and Ftx KO females. Percentages in leucocytes are shown on the graphs beneath. Each triangle represents a mouse. Median values are shown. ( t-test , * p -values < 0.05). g. Representative flow cytometry analysis of (CD19 + B220 lo CD5 + ) natural antibody producing B1a in the peritoneal cavity (PerC) of 1-year-old WT and Ftx KO females. Percentages in leucocytes are shown on the graphs beneath. Each triangle represents a mouse. Median values are shown. ( t-test , * p -values < 0.05). h. Cytokines levels in the blood analysed with CBA assays on sera from 3-month-, 1-year-, or 2-year-old WT and Ftx KO females. Each triangle represents a mouse. Median values are shown. ( t-test , * p -values < 0.05). i. Representative flow cytometry analysis of monocyte populations including non-classical (CD11b hi CD43 lo Ly6C + ) scavenger monocytes in the spleen of 1-year-old WT and Ftx KO females. Percentages in leucocytes are shown on the graphs beneath. Each triangle represents a mouse. Median values are shown. ( t-test , * p -values < 0.05).

Journal: bioRxiv

Article Title: Altered X-chromosome inactivation predisposes to autoimmune manifestations in mice

doi: 10.1101/2023.04.20.537662

Figure Lengend Snippet: a. Spleen weight of wild-type (WT) and Ftx KO females at 3-months, 1-year and 2-years of age. Median values are shown. ( t-test , * p -values < 0.05). Underneath, representative images of WT and Ftx KO spleens from 3-month, 1-year and 2-year-old females. b. Representative images of hematoxylin-eosin staining on sections of spleens from 1-year-old WT and Ftx KO females. Scale bar; 100 μm. c. Representative flow cytometry analysis of splenic myeloid dendritic cells (m-DC) in WT and Ftx KO 1-year-old females. On the right, percentages of splenic m-DC (CD11b + CD11c + ) and splenic plasmacytoid dendritic cells (p-DC) (CD11c + B220 + SiglecH + ) in leucocytes. Each triangle represents a mouse. Median values are shown. ( t-test , * p -values < 0.05). d. Representative flow cytometry analysis of spontaneously activated B cells (B220 + CD69 + ) (upper panels) or of spontaneously activated T cells (CD4 + CD69 + ) (lower panels) in spleen from 1-year-old WT and Ftx KO females. Percentages in leucocytes are shown on the graphs beneath. Each triangle represents a mouse. Median values are shown. ( t-test , * p -values < 0.05). e. IgG2a natural antibody levels in sera of 1-year- and 2-year-old WT or Ftx KO females measured by ELISA. Each triangle represents a mouse. Median values are shown. ( t-test , * p -values < 0.05). f. Representative flow cytometry analysis of (B220 + CD138 + ) plasma cells in the spleen of 1-year-old WT and Ftx KO females. Percentages in leucocytes are shown on the graphs beneath. Each triangle represents a mouse. Median values are shown. ( t-test , * p -values < 0.05). g. Representative flow cytometry analysis of (CD19 + B220 lo CD5 + ) natural antibody producing B1a in the peritoneal cavity (PerC) of 1-year-old WT and Ftx KO females. Percentages in leucocytes are shown on the graphs beneath. Each triangle represents a mouse. Median values are shown. ( t-test , * p -values < 0.05). h. Cytokines levels in the blood analysed with CBA assays on sera from 3-month-, 1-year-, or 2-year-old WT and Ftx KO females. Each triangle represents a mouse. Median values are shown. ( t-test , * p -values < 0.05). i. Representative flow cytometry analysis of monocyte populations including non-classical (CD11b hi CD43 lo Ly6C + ) scavenger monocytes in the spleen of 1-year-old WT and Ftx KO females. Percentages in leucocytes are shown on the graphs beneath. Each triangle represents a mouse. Median values are shown. ( t-test , * p -values < 0.05).

Article Snippet: Bone marrow, spleen, blood and peritoneal cavity cells were stained using the following antibodies: CD3 PerCP-Vio770 (130-119-656, Miltenyi Biotec), CD4-APC (130-123-207, Miltenyi Biotec), CD5-APC-Vio770 (130-120-165, Miltenyi Biotec), CD8-FITC (130-118-468, Miltenyi Biotec), CD11b APC (553312, BD Pharmingen), CD11c PE-Vio770 (130-110-840, Miltenyi Biotec), CD19-FITC (557398, BD Pharmingen), CD21-APC-Vio770 (130-111-733, Miltenyi Biotec), CD23-PE-Vio770 (130-118-764, Miltenyi Biotec), CD38-PE (130-123-571, Miltenyi Biotec), CD43-PE (130-112-887, Miltenyi Biotec), CD69-PE (130-115-575, Miltenyi Biotec), CD138 PE-Vio615 (130-108-989, Miltenyi Biotec), F4/80 FITC (130-117-509, Miltenyi Biotec), Ter119 PE (130-112-909, Miltenyi Biotec), SiglecH APC-Vio770 (130-112-299, Miltenyi Biotec), B220-APC (130-110-847, Miltenyi Biotec), B220 VioBlue (130-110-851, Miltenyi Biotec), IgM-VioBlue (130-116-318, Miltenyi Biotec), IgD-PE (130-111-496, Miltenyi Biotec), GL7-PE-Cy7 (144619, BioLegend), Ly6C-FITC (130-111-915, Miltenyi Biotec) following recommendations of the manufacturers.

Techniques: Staining, Flow Cytometry, Enzyme-linked Immunosorbent Assay, Clinical Proteomics

( A ) Serum antibodies from Aff3 flox/flox Cd4cre and Cd19cre mice were measured by ELISA ( n = 5 in each group). ( B ) Flow cytometry analysis of class switching to IgG1. CD43 − B cells were harvested from Aff3 +/− (purple) or Aff3 −/− (red) mice and cultured with LPS and IL-4 (10 μg/ml). After 4 days, the cells were analyzed by flow cytometry. The panels show the IgG1 and IgG3 expression profiles and the statistical analysis ( n = 4 in each group). ( C ) Flow cytometry analysis of class switching to IgG2c. CD43 − B cells were cultured with LPS and IFN-γ (10 μg/ml). The panels show the IgG2c expression profiles and the statistical analysis ( n = 3 in each group). ( D ) Overexpression of the AFF3 compensated for the Aff3 −/− phenotype. CD43 − B cells were harvested from Aff3 −/− mice and cultured with LPS and IL-4. The cDNAs of Aff3 , Aff1 , and Aff4 were transduced with a retroviral vector carrying the green fluorescent protein (GFP) marker. The panel shows the percentage of IgG1 + cells in GFP + CD19 + cells ( n = 3 in each group). EV, empty vector. The data are shown as means ± SEM. * P < 0.05, *** P < 0.005, and **** P < 0.001. The P values were calculated using unpaired t test with Welch’s correction in (A to C) and via one-way ANOVA with Dunnett’s multiple comparisons test in (D). The data shown in this figure are representative of at least two experiments.

Journal: Science Advances

Article Title: AFF3, a susceptibility factor for autoimmune diseases, is a molecular facilitator of immunoglobulin class switch recombination

doi: 10.1126/sciadv.abq0008

Figure Lengend Snippet: ( A ) Serum antibodies from Aff3 flox/flox Cd4cre and Cd19cre mice were measured by ELISA ( n = 5 in each group). ( B ) Flow cytometry analysis of class switching to IgG1. CD43 − B cells were harvested from Aff3 +/− (purple) or Aff3 −/− (red) mice and cultured with LPS and IL-4 (10 μg/ml). After 4 days, the cells were analyzed by flow cytometry. The panels show the IgG1 and IgG3 expression profiles and the statistical analysis ( n = 4 in each group). ( C ) Flow cytometry analysis of class switching to IgG2c. CD43 − B cells were cultured with LPS and IFN-γ (10 μg/ml). The panels show the IgG2c expression profiles and the statistical analysis ( n = 3 in each group). ( D ) Overexpression of the AFF3 compensated for the Aff3 −/− phenotype. CD43 − B cells were harvested from Aff3 −/− mice and cultured with LPS and IL-4. The cDNAs of Aff3 , Aff1 , and Aff4 were transduced with a retroviral vector carrying the green fluorescent protein (GFP) marker. The panel shows the percentage of IgG1 + cells in GFP + CD19 + cells ( n = 3 in each group). EV, empty vector. The data are shown as means ± SEM. * P < 0.05, *** P < 0.005, and **** P < 0.001. The P values were calculated using unpaired t test with Welch’s correction in (A to C) and via one-way ANOVA with Dunnett’s multiple comparisons test in (D). The data shown in this figure are representative of at least two experiments.

Article Snippet: Naïve B cells were purified by negative selection using a biotin-conjugated anti-CD43 antibody (Miltenyi Biotec, 130-101-954) and anti-biotin magnetic beads (Miltenyi Biotec, 130-090-485) according to the manufacturer’s protocol.

Techniques: Enzyme-linked Immunosorbent Assay, Flow Cytometry, Cell Culture, Expressing, Over Expression, Transduction, Retroviral, Plasmid Preparation, Marker

( A ) CD43 − B cells were stained with CFSE and cultured. The cells were analyzed by flow cytometry. ( B ) Transcriptome analysis of Aff3 -deficient B cells. CD43 − B cells were cultured with LPS and IL-4. After 3 days of culture, total RNA was prepared and analyzed on a cDNA microarray. ( C ) Quantitative reverse transcription polymerase chain reaction (qRT-PCR) and Western blotting analyses of Aicda ( n = 3 in each group for RT-PCR). CD43 − B cells were cultured with LPS (10 μg/ml) and IL-4 (10 ng/ml). Western blotting was performed with anti-AID antibody, and the membrane was reprobed with anti–extracellular signal–regulated kinase 1/2 (ERK1/2) antibody to assess the loading amounts. nt, nucleotide. ( D ) AFF3 binds to switch regions. CD43 − B cells were cultured with LPS (10 μg/ml) and IL-4 (10 ng/ml) for 3 days. Empty (purple) or 3xFLAG-tagged cDNA of the C-terminal half of Aff3 (red) was transduced. The efficiency of transduction was estimated on the basis of the expression of enhanced GFP (EGFP), which was coexpressed with AFF3 by IRES (internal ribosomal entry site) insertion. Then, the cells were analyzed by ChIP with an anti-FLAG antibody. The amount of DNA precipitated was measured by real-time PCR ( n = 3 in each group), with primers specific to the switch regions or the Acta (encoding α-actin) gene serving as a negative control. Sμ-SR indicates the switch region of IgM (table S4) . Sγ1-c and Sγ1-d indicate the switch region of IgG1 (fig. S7 and table S4). In (C and D), the data are shown as means ± SEM. **** P < 0.001. The P values were calculated using unpaired t tests with Welch’s correction. The data shown in this figure are representative of at least two experiments except for those in (B). The primers used in the experiments are listed in table S4.

Journal: Science Advances

Article Title: AFF3, a susceptibility factor for autoimmune diseases, is a molecular facilitator of immunoglobulin class switch recombination

doi: 10.1126/sciadv.abq0008

Figure Lengend Snippet: ( A ) CD43 − B cells were stained with CFSE and cultured. The cells were analyzed by flow cytometry. ( B ) Transcriptome analysis of Aff3 -deficient B cells. CD43 − B cells were cultured with LPS and IL-4. After 3 days of culture, total RNA was prepared and analyzed on a cDNA microarray. ( C ) Quantitative reverse transcription polymerase chain reaction (qRT-PCR) and Western blotting analyses of Aicda ( n = 3 in each group for RT-PCR). CD43 − B cells were cultured with LPS (10 μg/ml) and IL-4 (10 ng/ml). Western blotting was performed with anti-AID antibody, and the membrane was reprobed with anti–extracellular signal–regulated kinase 1/2 (ERK1/2) antibody to assess the loading amounts. nt, nucleotide. ( D ) AFF3 binds to switch regions. CD43 − B cells were cultured with LPS (10 μg/ml) and IL-4 (10 ng/ml) for 3 days. Empty (purple) or 3xFLAG-tagged cDNA of the C-terminal half of Aff3 (red) was transduced. The efficiency of transduction was estimated on the basis of the expression of enhanced GFP (EGFP), which was coexpressed with AFF3 by IRES (internal ribosomal entry site) insertion. Then, the cells were analyzed by ChIP with an anti-FLAG antibody. The amount of DNA precipitated was measured by real-time PCR ( n = 3 in each group), with primers specific to the switch regions or the Acta (encoding α-actin) gene serving as a negative control. Sμ-SR indicates the switch region of IgM (table S4) . Sγ1-c and Sγ1-d indicate the switch region of IgG1 (fig. S7 and table S4). In (C and D), the data are shown as means ± SEM. **** P < 0.001. The P values were calculated using unpaired t tests with Welch’s correction. The data shown in this figure are representative of at least two experiments except for those in (B). The primers used in the experiments are listed in table S4.

Article Snippet: Naïve B cells were purified by negative selection using a biotin-conjugated anti-CD43 antibody (Miltenyi Biotec, 130-101-954) and anti-biotin magnetic beads (Miltenyi Biotec, 130-090-485) according to the manufacturer’s protocol.

Techniques: Staining, Cell Culture, Flow Cytometry, Microarray, Reverse Transcription, Polymerase Chain Reaction, Quantitative RT-PCR, Western Blot, Reverse Transcription Polymerase Chain Reaction, Membrane, Transduction, Expressing, Real-time Polymerase Chain Reaction, Negative Control

( A ) qRT-PCR was used to analyze the germline and postswitch transcript levels of IgG1 ( n = 3 in each group). Aff3 +/− (purple) or Aff3 −/− (red) CD43 − B cells were cultured with LPS (10 μg/ml) and the indicated amount of IL-4. After 3 days of culture, total RNA was extracted from the cells and analyzed. ( B ) Semiquantitative PCR was performed to analyze CSR. CD43 B cells were cultured as described in (A), and genomic DNA was extracted. PCR of the IgM and IgG1 switch regions in combination was performed with the indicated primers. The genomic DNA was serially diluted and used as the template for PCR. Primers for CD19 were used as an internal control. ( C ) Genomic DNA was prepared as described in (B). Fragments of IgM-IgG1 chimeric switch regions were amplified by nested PCR. The fragments were sequenced, and the mutation rates per nucleotide were plotted ( n = 3 in each group). The detailed data are shown in table S1. In (A and C), the data are shown as means ± SEM. * P < 0.05 and *** P < 0.005. The P values were calculated using unpaired t tests with Welch’s correction. The data in (A and B) are representative of at least two experiments. The primers used are listed in table S4.

Journal: Science Advances

Article Title: AFF3, a susceptibility factor for autoimmune diseases, is a molecular facilitator of immunoglobulin class switch recombination

doi: 10.1126/sciadv.abq0008

Figure Lengend Snippet: ( A ) qRT-PCR was used to analyze the germline and postswitch transcript levels of IgG1 ( n = 3 in each group). Aff3 +/− (purple) or Aff3 −/− (red) CD43 − B cells were cultured with LPS (10 μg/ml) and the indicated amount of IL-4. After 3 days of culture, total RNA was extracted from the cells and analyzed. ( B ) Semiquantitative PCR was performed to analyze CSR. CD43 B cells were cultured as described in (A), and genomic DNA was extracted. PCR of the IgM and IgG1 switch regions in combination was performed with the indicated primers. The genomic DNA was serially diluted and used as the template for PCR. Primers for CD19 were used as an internal control. ( C ) Genomic DNA was prepared as described in (B). Fragments of IgM-IgG1 chimeric switch regions were amplified by nested PCR. The fragments were sequenced, and the mutation rates per nucleotide were plotted ( n = 3 in each group). The detailed data are shown in table S1. In (A and C), the data are shown as means ± SEM. * P < 0.05 and *** P < 0.005. The P values were calculated using unpaired t tests with Welch’s correction. The data in (A and B) are representative of at least two experiments. The primers used are listed in table S4.

Article Snippet: Naïve B cells were purified by negative selection using a biotin-conjugated anti-CD43 antibody (Miltenyi Biotec, 130-101-954) and anti-biotin magnetic beads (Miltenyi Biotec, 130-090-485) according to the manufacturer’s protocol.

Techniques: Quantitative RT-PCR, Cell Culture, Control, Amplification, Nested PCR, Mutagenesis

CD38 is co-expressed with known regulators of CD45 activity in activated CLL cells (A) Stimulated CLL cells display a robust increase in the CD38 + /CD43 hi population. Additionally, CD43 hi /galectin-1 + population (a previously identified CD45 activity hi population) has high CD38 expression in comparison to the CD43 lo /galectin-1 − counterpart population. Top row are representative flow cytometry scatterplots of CD38 + /CD43 hi populations in unstimulated and stimulated CLL cells. Bottom row is a representative scatterplot of stimulated CD43 hi /galectin-1 + and CD43 lo /galectin-1 − CLL populations and a representative histogram of CD38 expression in those populations. (B) When assessing stimulated CLL cells, the CD38 + /CD43 hi population had the highest CD45 activity, galectin-1 expression, and proliferative output when compared to CD38 + /CD43 lo and CD38 − /CD43 lo populations. Included are representative histograms for each respective parameter and a representative flow cytometry scatterplot delineating the populations. (C) Confocal images localizing CD38 (blue), CD45 (green), and CD43 (red) in isolated CLL cells. A region of interest was taken from the overlay and the fluorophore intensity (y axis, RGB profiler tool) plotted at a given pixel number (x axis). Statistical significance was defined with Wilcoxon matched-pairs signed rank test (A) and Friedman’s test with Dunn’s multiple comparisons test (B). Data is representative of 11 CLL patient samples (A, top row), 9 patient samples (A, bottom row), and 16 (left), 13 (middle), and 16 (right) patients for (B).

Journal: Molecular Therapy Oncology

Article Title: CD38 regulates chronic lymphocytic leukemia proliferation via CD45 phosphatase activity

doi: 10.1016/j.omton.2024.200841

Figure Lengend Snippet: CD38 is co-expressed with known regulators of CD45 activity in activated CLL cells (A) Stimulated CLL cells display a robust increase in the CD38 + /CD43 hi population. Additionally, CD43 hi /galectin-1 + population (a previously identified CD45 activity hi population) has high CD38 expression in comparison to the CD43 lo /galectin-1 − counterpart population. Top row are representative flow cytometry scatterplots of CD38 + /CD43 hi populations in unstimulated and stimulated CLL cells. Bottom row is a representative scatterplot of stimulated CD43 hi /galectin-1 + and CD43 lo /galectin-1 − CLL populations and a representative histogram of CD38 expression in those populations. (B) When assessing stimulated CLL cells, the CD38 + /CD43 hi population had the highest CD45 activity, galectin-1 expression, and proliferative output when compared to CD38 + /CD43 lo and CD38 − /CD43 lo populations. Included are representative histograms for each respective parameter and a representative flow cytometry scatterplot delineating the populations. (C) Confocal images localizing CD38 (blue), CD45 (green), and CD43 (red) in isolated CLL cells. A region of interest was taken from the overlay and the fluorophore intensity (y axis, RGB profiler tool) plotted at a given pixel number (x axis). Statistical significance was defined with Wilcoxon matched-pairs signed rank test (A) and Friedman’s test with Dunn’s multiple comparisons test (B). Data is representative of 11 CLL patient samples (A, top row), 9 patient samples (A, bottom row), and 16 (left), 13 (middle), and 16 (right) patients for (B).

Article Snippet: The following antibodies (clone, company, concentration) were resuspended in staining buffer (PBS with 2% BSA): Mouse anti-human CD45 (H130, BioLegend, 1:100), goat anti-human CD43 (polyclonal, R&D Systems, 1:50), rabbit anti-human CD38 (polyclonal, Thermo Fisher Scientific, 1:50), donkey anti-mouse Alexa Fluor 488 (1:500, Thermo Fisher Scientific), donkey anti-goat Alexa Fluor 555 (1:500, Thermo Fisher Scientific), and donkey anti-rabbit Alexa Fluor 647 (1:500, Thermo Fisher Scientific).

Techniques: Activity Assay, Expressing, Comparison, Flow Cytometry, Isolation

Inhibiting CD38 enzymatic activity reduced CLL proliferation and CD45 activity hi populations (A) Schematic depicting the experimental setup. Created with BioRender.com . (B and C) Treatment with the CD38 enzymatic inhibitor 78c in Th-CLL cell co-cultures reduced the CLL proliferative (Ki67 + ) output in a concentration-dependent manner. Representative flow cytometry scatterplots of CLL (top row) and Th cell (bottom row) proliferation at the indicated concentrations. Th cell proliferation remained unaffected. %Ki67 + was normalized as ratio over vehicle for Th versus CLL comparison. (D and E) Treatment with 78c also selectively decrease the CD45 activity hi populations CD38 + /CD43 hi (top row) and CD43 hi /galectin-1 + (bottom row) in CLL cells. Included are representative flow cytometry scatterplots. Normalized graphs (ratio over vehicle) have also been provided for comparison. Statistical significance was calculated by Friedman’s test with Dunn’s multiple comparisons test (C), repeated-measures one-way ANOVA with Dunnett’s multiple comparisons test (E), and two-way ANOVA for Th versus CLL cell comparisons. Data are representative of eight CLL patient samples.

Journal: Molecular Therapy Oncology

Article Title: CD38 regulates chronic lymphocytic leukemia proliferation via CD45 phosphatase activity

doi: 10.1016/j.omton.2024.200841

Figure Lengend Snippet: Inhibiting CD38 enzymatic activity reduced CLL proliferation and CD45 activity hi populations (A) Schematic depicting the experimental setup. Created with BioRender.com . (B and C) Treatment with the CD38 enzymatic inhibitor 78c in Th-CLL cell co-cultures reduced the CLL proliferative (Ki67 + ) output in a concentration-dependent manner. Representative flow cytometry scatterplots of CLL (top row) and Th cell (bottom row) proliferation at the indicated concentrations. Th cell proliferation remained unaffected. %Ki67 + was normalized as ratio over vehicle for Th versus CLL comparison. (D and E) Treatment with 78c also selectively decrease the CD45 activity hi populations CD38 + /CD43 hi (top row) and CD43 hi /galectin-1 + (bottom row) in CLL cells. Included are representative flow cytometry scatterplots. Normalized graphs (ratio over vehicle) have also been provided for comparison. Statistical significance was calculated by Friedman’s test with Dunn’s multiple comparisons test (C), repeated-measures one-way ANOVA with Dunnett’s multiple comparisons test (E), and two-way ANOVA for Th versus CLL cell comparisons. Data are representative of eight CLL patient samples.

Article Snippet: The following antibodies (clone, company, concentration) were resuspended in staining buffer (PBS with 2% BSA): Mouse anti-human CD45 (H130, BioLegend, 1:100), goat anti-human CD43 (polyclonal, R&D Systems, 1:50), rabbit anti-human CD38 (polyclonal, Thermo Fisher Scientific, 1:50), donkey anti-mouse Alexa Fluor 488 (1:500, Thermo Fisher Scientific), donkey anti-goat Alexa Fluor 555 (1:500, Thermo Fisher Scientific), and donkey anti-rabbit Alexa Fluor 647 (1:500, Thermo Fisher Scientific).

Techniques: Activity Assay, Concentration Assay, Flow Cytometry, Comparison

The CD38 blocking mAb AT-1 reduced CLL proliferation and CD45 activity hi populations (A) Schematic depicting the experimental setup. Created with BioRender.com . (B and C) Treatment with increasing concentrations of the mAb AT-1 reduced CLL cell proliferation (Ki67 + ) while leaving Th cell proliferation largely intact. Included are representative flow cytometry scatterplots of CLL (top row) and Th cells (bottom row). %Ki67 + was normalized as ratio over isotype for comparative graphs. (D and E) Increasing concentration of the mAb AT-1 selectively decreased the CD45 activity hi populations CD38 + /CD43 hi (top row) and CD43 hi /galectin-1 + (bottom row). Representative flow cytometry scatterplots from the indicated concentrations are included. To account for the inherent variability of the CD45acivity hi population between CLL patients (left graphs), data was normalized to isotype control values (right graphs). Statistical significance was defined by Friedman’s test with Dunn’s multiple comparisons test (C and E [CLL CD43 hi /galectin-1 + left graph]), repeated-measures one-way ANOVA with Dunnett’s multiple comparisons test (rest of E), and two-way ANOVA for Th versus CLL cell comparisons. Data are representative of six CLL patient samples.

Journal: Molecular Therapy Oncology

Article Title: CD38 regulates chronic lymphocytic leukemia proliferation via CD45 phosphatase activity

doi: 10.1016/j.omton.2024.200841

Figure Lengend Snippet: The CD38 blocking mAb AT-1 reduced CLL proliferation and CD45 activity hi populations (A) Schematic depicting the experimental setup. Created with BioRender.com . (B and C) Treatment with increasing concentrations of the mAb AT-1 reduced CLL cell proliferation (Ki67 + ) while leaving Th cell proliferation largely intact. Included are representative flow cytometry scatterplots of CLL (top row) and Th cells (bottom row). %Ki67 + was normalized as ratio over isotype for comparative graphs. (D and E) Increasing concentration of the mAb AT-1 selectively decreased the CD45 activity hi populations CD38 + /CD43 hi (top row) and CD43 hi /galectin-1 + (bottom row). Representative flow cytometry scatterplots from the indicated concentrations are included. To account for the inherent variability of the CD45acivity hi population between CLL patients (left graphs), data was normalized to isotype control values (right graphs). Statistical significance was defined by Friedman’s test with Dunn’s multiple comparisons test (C and E [CLL CD43 hi /galectin-1 + left graph]), repeated-measures one-way ANOVA with Dunnett’s multiple comparisons test (rest of E), and two-way ANOVA for Th versus CLL cell comparisons. Data are representative of six CLL patient samples.

Article Snippet: The following antibodies (clone, company, concentration) were resuspended in staining buffer (PBS with 2% BSA): Mouse anti-human CD45 (H130, BioLegend, 1:100), goat anti-human CD43 (polyclonal, R&D Systems, 1:50), rabbit anti-human CD38 (polyclonal, Thermo Fisher Scientific, 1:50), donkey anti-mouse Alexa Fluor 488 (1:500, Thermo Fisher Scientific), donkey anti-goat Alexa Fluor 555 (1:500, Thermo Fisher Scientific), and donkey anti-rabbit Alexa Fluor 647 (1:500, Thermo Fisher Scientific).

Techniques: Blocking Assay, Activity Assay, Flow Cytometry, Concentration Assay, Control

CLL-intrinsic effect of CD38 enzymatic and receptor inhibition (A) Schematic depicting the experimental setup. Created with BioRender.com . Isolated CLL cells were treated for 1 or 24 h with CD38 enzymatic inhibitor 78c (B and D) or mAb AT-1 (C and E). One-hour inhibition with 78c did not alter CLL pSyk activation, proliferation, or cell viability (B). Conversely, 1-h inhibition with AT-1 reduced CLL pSyk activation and proliferation, while similarly leaving cell viability unaffected (C). Included are representative histograms for pSyk and representative flow cytometry scatterplots. The 24-h enzymatic inhibition did not affect pSyk activation or cell viability, but decreased the proliferative output of CLL cells (D). Alongside a concomitant reduction in proliferation without reduction in cell viability, 24-h receptor block robustly reduced CLL pSyk activation (E). Examination of SPN (CD43) and LGALS1 (galectin-1) gene expression at 24 h 78c treatment revealed a robust decrease in both SPN and LGALS1 mRNA levels (F), while AT-1 treatment revealed a significant reduction in SPN mRNA with a near significant reduction in LGALS1 mRNA ( p = 0.065) (G). All mRNA expression levels are relative quantity normalized to POLR2A (F and G). Statistical significance was defined with Student’s ratio paired t test (B–D [pSyk, Ki67], E [pSyk]), Wilcoxon matched-pairs signed rank test (D [live/dead], E [Ki67, live/dead]), and Student’s paired t test (F and G). Data are representative of 6 (F left graph), 7 (B, C, F right graph), 8 (D, G left graph), 9 (E), and 11 (G right graph) CLL patient samples.

Journal: Molecular Therapy Oncology

Article Title: CD38 regulates chronic lymphocytic leukemia proliferation via CD45 phosphatase activity

doi: 10.1016/j.omton.2024.200841

Figure Lengend Snippet: CLL-intrinsic effect of CD38 enzymatic and receptor inhibition (A) Schematic depicting the experimental setup. Created with BioRender.com . Isolated CLL cells were treated for 1 or 24 h with CD38 enzymatic inhibitor 78c (B and D) or mAb AT-1 (C and E). One-hour inhibition with 78c did not alter CLL pSyk activation, proliferation, or cell viability (B). Conversely, 1-h inhibition with AT-1 reduced CLL pSyk activation and proliferation, while similarly leaving cell viability unaffected (C). Included are representative histograms for pSyk and representative flow cytometry scatterplots. The 24-h enzymatic inhibition did not affect pSyk activation or cell viability, but decreased the proliferative output of CLL cells (D). Alongside a concomitant reduction in proliferation without reduction in cell viability, 24-h receptor block robustly reduced CLL pSyk activation (E). Examination of SPN (CD43) and LGALS1 (galectin-1) gene expression at 24 h 78c treatment revealed a robust decrease in both SPN and LGALS1 mRNA levels (F), while AT-1 treatment revealed a significant reduction in SPN mRNA with a near significant reduction in LGALS1 mRNA ( p = 0.065) (G). All mRNA expression levels are relative quantity normalized to POLR2A (F and G). Statistical significance was defined with Student’s ratio paired t test (B–D [pSyk, Ki67], E [pSyk]), Wilcoxon matched-pairs signed rank test (D [live/dead], E [Ki67, live/dead]), and Student’s paired t test (F and G). Data are representative of 6 (F left graph), 7 (B, C, F right graph), 8 (D, G left graph), 9 (E), and 11 (G right graph) CLL patient samples.

Article Snippet: The following antibodies (clone, company, concentration) were resuspended in staining buffer (PBS with 2% BSA): Mouse anti-human CD45 (H130, BioLegend, 1:100), goat anti-human CD43 (polyclonal, R&D Systems, 1:50), rabbit anti-human CD38 (polyclonal, Thermo Fisher Scientific, 1:50), donkey anti-mouse Alexa Fluor 488 (1:500, Thermo Fisher Scientific), donkey anti-goat Alexa Fluor 555 (1:500, Thermo Fisher Scientific), and donkey anti-rabbit Alexa Fluor 647 (1:500, Thermo Fisher Scientific).

Techniques: Inhibition, Isolation, Activation Assay, Flow Cytometry, Blocking Assay, Gene Expression, Expressing

CD38 regulates BCR signaling and CD45 activity through CD43 and galectin-1 in malignant B cells (A) Schematic depicting generation of CRISPR-Cas9 gene edited cells and the downstream workflow. Created with BioRender.com . (B) When comparing to Ramos. WT , Ramos. CD38 KO cells demonstrated reduced surface expression of CD43 and galectin-1, alongside a concomitant reduction in CD45 activity (pCAP-SP1). Included are representative histograms (Ramos. WT filled histograms, Ramos. CD38 KO dashed histograms). Investigation of proximal (pSyk, pBtk) and distal (pErk) BCR signaling kinases showed decreased activation of all three in Ramos. CD38 KO cells. Included are representative histograms (Ramos. WT filled histograms, Ramos. CD38 KO dashed histograms). Data were obtained from two individual Ramos. CD38 KO clones (A and B). (C) On the mRNA level, SPN (CD43) gene expression was reduced in Ramos. CD38 KO cells while LGALS1 (galectin-1) gene expression was not. Intracellular galectin-1 expression was consistent between Ramos. WT and Ramos. CD38 KO cells. Included are representative histograms. (D) Confocal images with the red signal representing co-localization of CD43/CD45 (PLA particles, see schematic created with BioRender.com .; scale bar, 5 μm). Analysis revealed the PLA particles were significantly reduced in Ramos. LGALS1 KO cells in comparison to Ramos. WT . Statistical significance was determined by Student’s unpaired t test (B: pCAP-SP1, CD43, pSyk, pBTK, Ki67), Mann-Whitney Test (B: pErk, galectin-1), and one-way ANOVA with Tukey’s multiple comparisons test (D).

Journal: Molecular Therapy Oncology

Article Title: CD38 regulates chronic lymphocytic leukemia proliferation via CD45 phosphatase activity

doi: 10.1016/j.omton.2024.200841

Figure Lengend Snippet: CD38 regulates BCR signaling and CD45 activity through CD43 and galectin-1 in malignant B cells (A) Schematic depicting generation of CRISPR-Cas9 gene edited cells and the downstream workflow. Created with BioRender.com . (B) When comparing to Ramos. WT , Ramos. CD38 KO cells demonstrated reduced surface expression of CD43 and galectin-1, alongside a concomitant reduction in CD45 activity (pCAP-SP1). Included are representative histograms (Ramos. WT filled histograms, Ramos. CD38 KO dashed histograms). Investigation of proximal (pSyk, pBtk) and distal (pErk) BCR signaling kinases showed decreased activation of all three in Ramos. CD38 KO cells. Included are representative histograms (Ramos. WT filled histograms, Ramos. CD38 KO dashed histograms). Data were obtained from two individual Ramos. CD38 KO clones (A and B). (C) On the mRNA level, SPN (CD43) gene expression was reduced in Ramos. CD38 KO cells while LGALS1 (galectin-1) gene expression was not. Intracellular galectin-1 expression was consistent between Ramos. WT and Ramos. CD38 KO cells. Included are representative histograms. (D) Confocal images with the red signal representing co-localization of CD43/CD45 (PLA particles, see schematic created with BioRender.com .; scale bar, 5 μm). Analysis revealed the PLA particles were significantly reduced in Ramos. LGALS1 KO cells in comparison to Ramos. WT . Statistical significance was determined by Student’s unpaired t test (B: pCAP-SP1, CD43, pSyk, pBTK, Ki67), Mann-Whitney Test (B: pErk, galectin-1), and one-way ANOVA with Tukey’s multiple comparisons test (D).

Article Snippet: The following antibodies (clone, company, concentration) were resuspended in staining buffer (PBS with 2% BSA): Mouse anti-human CD45 (H130, BioLegend, 1:100), goat anti-human CD43 (polyclonal, R&D Systems, 1:50), rabbit anti-human CD38 (polyclonal, Thermo Fisher Scientific, 1:50), donkey anti-mouse Alexa Fluor 488 (1:500, Thermo Fisher Scientific), donkey anti-goat Alexa Fluor 555 (1:500, Thermo Fisher Scientific), and donkey anti-rabbit Alexa Fluor 647 (1:500, Thermo Fisher Scientific).

Techniques: Activity Assay, CRISPR, Expressing, Activation Assay, Clone Assay, Gene Expression, Comparison, MANN-WHITNEY